
6.73× Conversion Lift: UGC Statistics 2026 and Where Instant UGC Fits
2026 benchmarks show 6.73× conversion lift and +22% PDP uplifts. See measurement fixes, scaling steps, and how Instant UGC maps to those results.
Pages featuring user-generated content converted at 6.73x the rate of non-UGC pages in a broad Q1 2026 benchmark, with visit volume running 4.11x higher on the same pages. Emplifi, Idukki, and Instant-UGC data all point the same direction: UGC is no longer a campaign tactic, it’s conversion infrastructure. If you run marketing for an e-commerce brand, an app, or a SaaS product, the practical move is simple. Put UGC where buyers decide, and measure it like you mean it.
TL;DR:
- UGC pages achieve an average of 6.73 times higher conversions and 4.11 times more traffic than non-UGC pages in Q1 2026 benchmarks.
- Placing heavily tagged, above-the-fold UGC galleries on product detail pages can increase conversions by around 22-34 percent.
- Mobile engagement dominates UGC interaction, with 78% of users responding to vertical, short-form videos and scroll-stopping content.
- Shoppable videos perform best on mobile, especially when tested on top traffic pages before broad rollout.
- Sourcing diverse UGC and automating rights management cut costs and improve localization, with translation boosting engagement by over 21 percent.
Table of Contents
- UGC Statistics 2026: The Core Numbers Marketers Need
- Benchmarks By Use Case: Ecommerce, Shoppable Video, and App/SaaS
- Why UGC Outperforms Polished Ads
- How to Measure UGC Impact Without Undercounting It
- Sourcing and Scaling UGC Operations in 2026
- Where Instant-UGC Fits Against These Numbers
- Hit These Benchmarks Without a Three-Week Production Cycle
- Sources
UGC Statistics 2026: The Core Numbers Marketers Need
The headline figure from Emplifi’s Q1 2026 benchmarks, drawn from thousands of brand accounts with normalized thresholds, shows UGC-driven conversions jumping from a 4.27x multiple to 6.73x quarter over quarter. That’s not a rounding blip. It reflects buyers increasingly filtering out anything that smells like a studio ad.
Idukki’s parallel dataset, built around product detail pages and shoppable video, adds the granular numbers marketers actually need for planning:
- Median PDP conversion uplift with a UGC gallery: +22%, with top-quartile stores clearing +34% or more.
- Shoppable video engagement runs notably higher than static image galleries.
- Mobile visitors account for 78% of gallery engagement, meaning vertical, thumb-stopping formats aren’t optional.
- Website visits to pages carrying UGC ran notably higher than pages without it.
- Shopper research aggregated by Backlinko shows 78% of buyers rank reviews as the most influential UGC type, followed by Q&A at 77% and shopper photos at 69%.
That’s the difference between a UGC gallery being a nice-to-have widget and being the single highest-leverage line item on your conversion rate optimization roadmap.
Retailer intent backs this up. Two-thirds of retailers surveyed for the Backlinko roundup say they plan to increase UGC investment this year, not hold flat. The direction of travel across every one of these datasets is the same: more UGC, tagged more aggressively, and placed higher on the page.
Benchmarks By Use Case: Ecommerce, Shoppable Video, and App/SaaS
Not every business gets the same lift from the same tactic, and treating a PDP gallery benchmark as universal is a mistake.
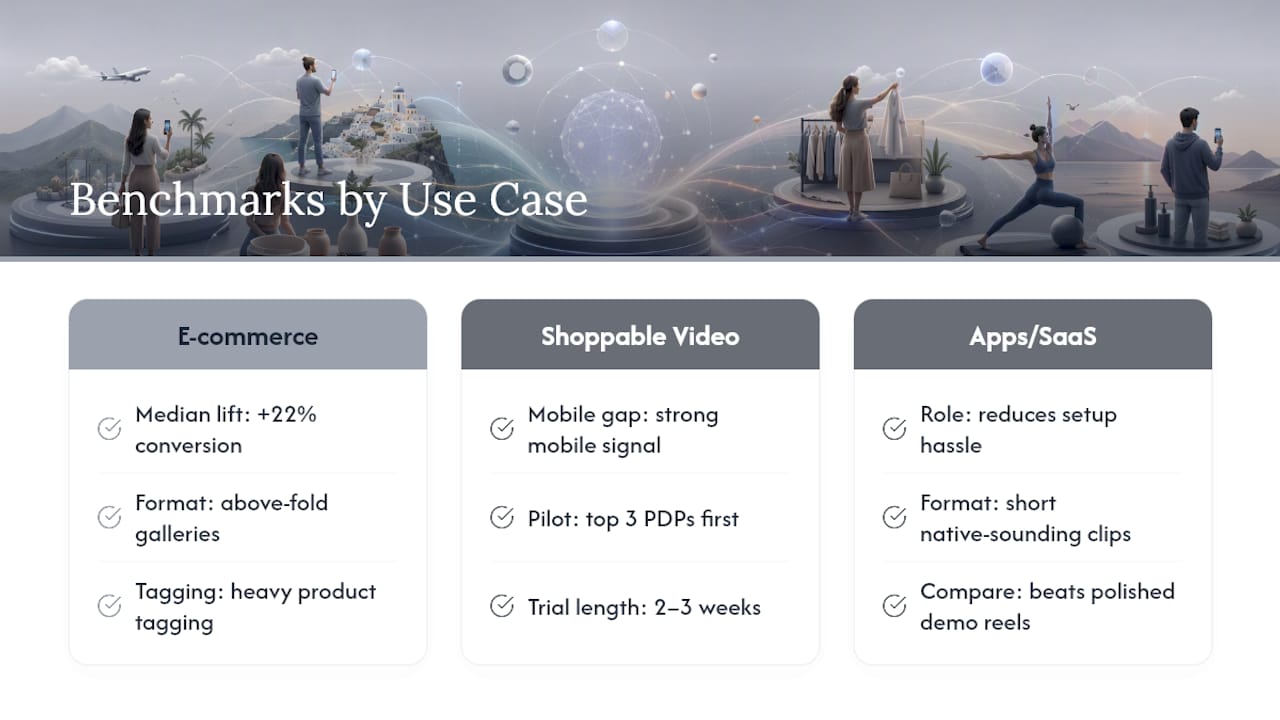
E-commerce product pages see the clearest signal. That median +22% conversion uplift comes specifically from galleries placed above the fold with heavy product tagging, according to Idukki’s 2026 dataset. Our guide to UGC for e-commerce breaks down placement mechanics in more detail.
Shoppable video is where the mobile gap really shows up.
Apps and SaaS products play a different game. Testimonial-style UGC on app-install and landing pages works less on the “does this product work” question and more on “will this feel like a hassle to set up.” Short, native-sounding clips that mimic a screen-recorded review tend to outperform polished demo reels for this exact reason.
Pro Tip: If you’re testing shoppable video for the first time, run it on your three highest-traffic PDPs before rolling out catalog-wide. You’ll see whether your audience is mobile-heavy enough to justify the production lift within two to three weeks.
Why UGC Outperforms Polished Ads
Trust is the mechanism, and 2026 data makes the gap explicit. eMarketer reports that 70% of Gen Z find UGC very helpful, while nearly two-thirds of respondents say they feel uneasy about ads they can identify as AI-generated.
That’s not an argument against using AI tools. It’s an argument for using them to produce content that feels human rather than content that announces itself as synthetic. The lesson: authenticity is the deliverable, not the delivery mechanism.
Attention mechanics reinforce the point. Rougher, less polished formats reduce the instinct to skip, because they read as a peer’s phone footage rather than a paid placement. A few creative choices consistently correlate with stronger view-through rates:
- Vertical 9:16 framing that matches native platform feeds
- Visible product tags rather than a link buried in a caption
- Short testimonial structure: problem, product, result, in under 20 seconds
- Burned-in captions for sound-off viewing
- Scripts that sound spoken, not written
Our earlier analysis of UGC ad performance covers the creative testing process behind these patterns in more depth.
How to Measure UGC Impact Without Undercounting It
Most brands measure UGC wrong, and the error almost always favors last-click attribution, which misses the mid-funnel nudge UGC actually provides. Fix the measurement, and the numbers above stop looking theoretical.
- Run A/B tests with a true holdout group. Holdout experiments tend to show larger lifts than simple A/B splits alone, because they capture network effects that a straight test/control comparison misses.
- Switch to multi-touch or data-driven attribution. Data-driven models typically report roughly 23% higher UGC contribution than last-click, according to Idukki’s operational benchmarking.
- Track a short KPI set, not a dashboard of vanity metrics: visit multiplier (target near 4x), PDP conversion uplift (median +20%), watch-through rate by format, and blended ROAS.
- Segment by device. Mobile-driven engagement skews shoppable video results, so a blended number can hide where the real lift is coming from.
If your holdout test shows less than that, the placement or format is likely the problem, not the concept. Our UGC testing platform guide walks through setting up a clean holdout structure.
Sourcing and Scaling UGC Operations in 2026
Volume without process breaks quality fast, which is why the brands hitting top-quartile numbers treat collection and rights management as a pipeline, not a one-off ask.
Multi-source collection wins over relying on a single channel. Hashtag listening on Instagram and TikTok, post-purchase email forms, in-email AMP submissions, and QR-code photobooths at live events each pull a different creator type, and blending them keeps galleries from looking repetitive.
Rights management moves faster than most teams assume. Idukki’s operational data shows 88% of brands in its cohort now use automated DM consent flows, with a median turnaround from first message to rights grant of just 7 hours and 40 minutes.
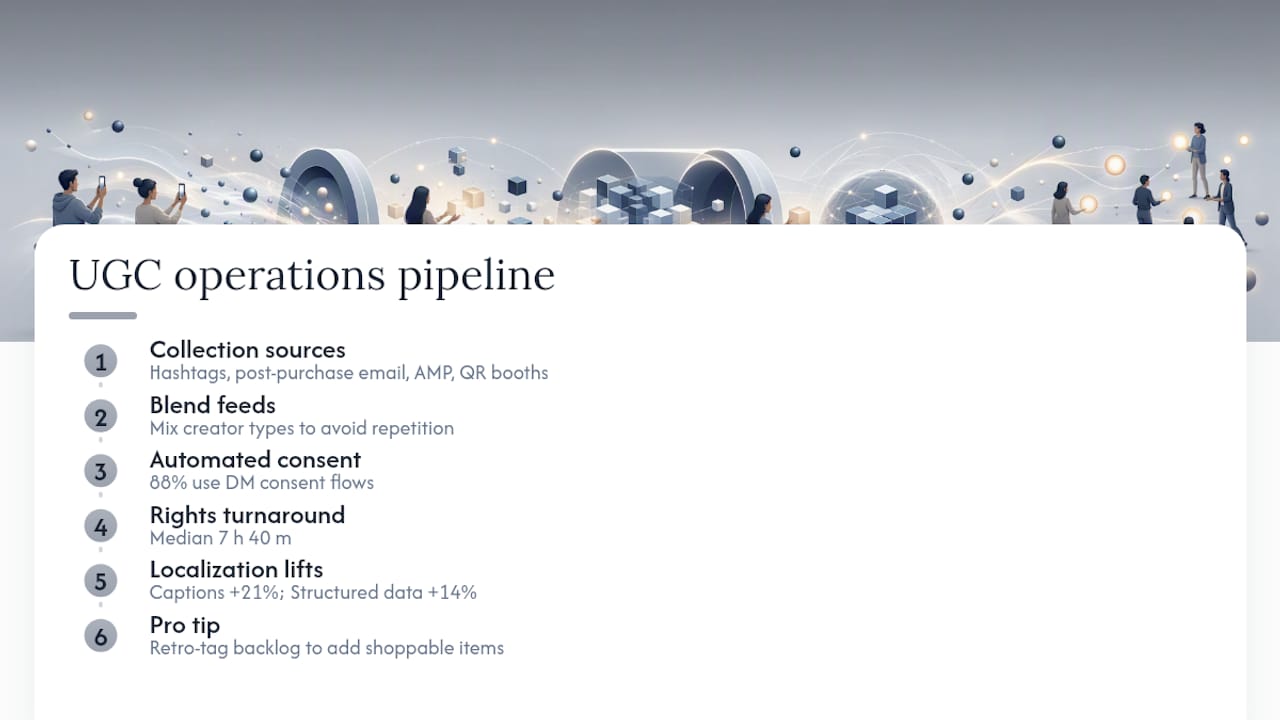
Localization is the most underused lever in this list. Translated captions lift engagement by 21%, and locale-specific structured data adds another 14% in organic uplift. For any brand selling across borders, that’s a bigger win than most paid media tweaks.
Pro Tip: Don’t wait until a gallery feels “full” to start tagging products in older UGC assets. Retroactively tagging a backlog of unused clips is often the fastest way to add shoppable inventory without shooting anything new.
Related reading on digital marketing trends for 2026 covers how these operational shifts fit into broader content strategy.
Where Instant-UGC Fits Against These Numbers
The benchmarks above assume brands can produce enough UGC-style creative to actually test placement, format, and localization at volume. That’s the bottleneck for most teams, not the strategy. Instant-UGC generates 9:16 videos in 90 to 120 seconds, with 10+ AI avatars, automatic script generation, and support for 17 languages, which turns the localization lift Idukki measured into something a small team can actually execute.
The clearest fit is rapid PDP and shoppable-video testing, plus multilingual campaigns where translation used to be the blocker.
— Syno
Hit These Benchmarks Without a Three-Week Production Cycle
Instant-UGC compresses that cycle to 90 to 120 seconds per video at $4 to $7 each, so testing five creative variants costs less than one traditional shoot.
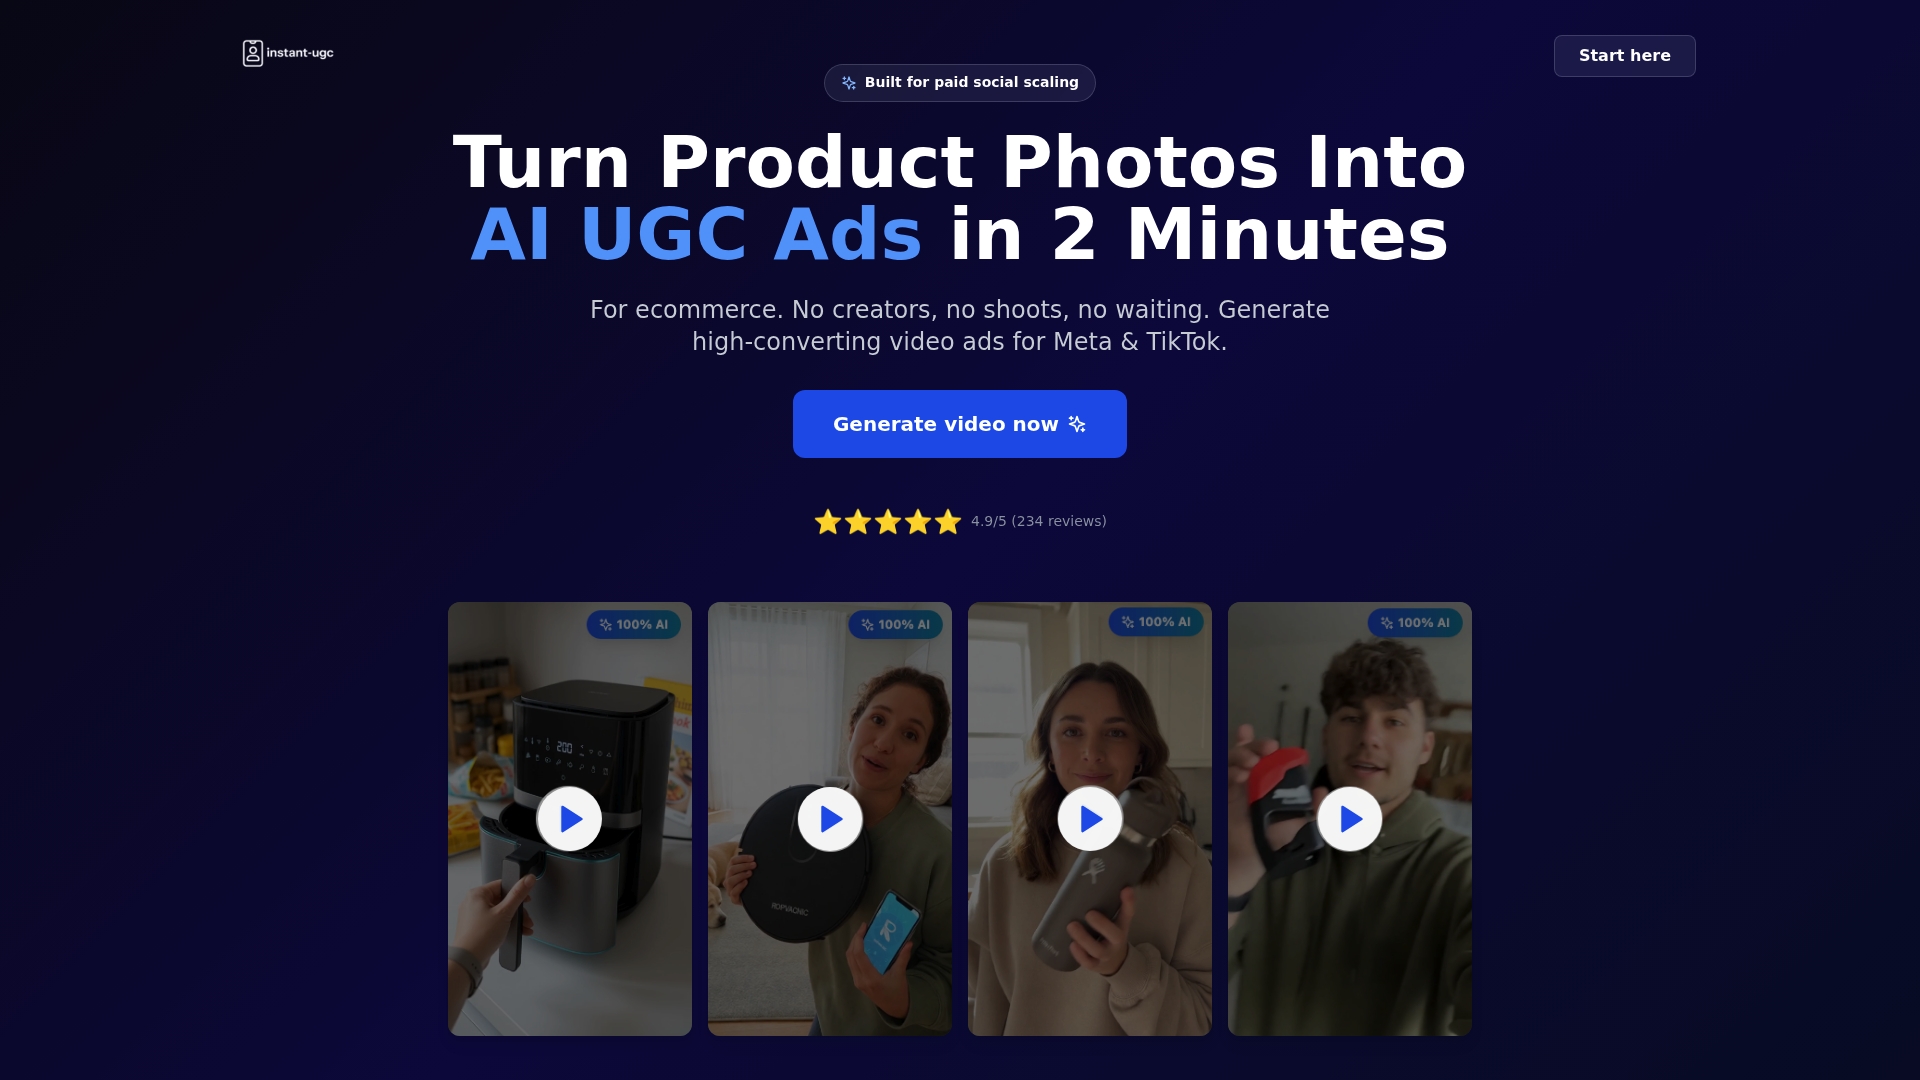
Start with a focused pilot: generate three videos for your highest-traffic product page or app-install screen, run them against your current gallery with a proper holdout, and watch conversion uplift or ROAS over two weeks. The AI product video generator is built for exactly this workflow, turning existing product photos into shoppable-ready creative without a production calendar. If your audience spans multiple markets, pair the pilot with multilingual video ads to capture the localization lift Idukki’s data points to. Set up your first pilot and see where your numbers land against the 2026 medians.
Sources
- User-generated content drives 6.7x higher conversions for brands, new data shows
- State of UGC + Shoppable Video 2026
- Audiences overwhelmingly prefer user-generated content over standard ads, AI
- 24 Key User-Generated Content (UGC) Statistics for 2026
Recommended
- Instant UGC vs Billo: Complete Platform Comparison & Best UGC Platform 2026 Guide
- UGC Ad Formats: Complete Technical Specifications and Platform Requirements for 2026
- UGC Conversion Optimization: Transform Customer Content Into Sales
- UGC Ad Performance: How User-Generated Content Drives Superior Results in 2026
