
Advertisers: Hit 30% Thumbstop Rate on Facebook With 90–120s UGC
Operational playbook for advertisers: calculate Facebook thumbstop rate, pull raw Ads Manager data, run hook tests, and scale winners using 90–120s UGC.
Thumbstop rate measures the share of impressions that turn into a three-second video view, calculated as (3-second plays ÷ impressions) × 100, though some teams substitute a 2-second continuous-view count. It’s the fastest read you’ll get on whether your video’s opening frame earns attention before the algorithm moves on. Above a workable threshold is generally considered good, while higher rates are strong indicators; anything below suggests the hook may need improvement before further investment.
TL;DR:
- A thumbstop rate above 20% indicates your video is effectively stopping viewers, with over 30% being a strong performance benchmark.
- Producing multiple quick, low-cost hook variants and testing them systematically increases the likelihood of finding high thumbstop rate creatives.
- Relying solely on thumbstop rate for scaling is risky; it must be validated with downstream metrics like click-through and conversion rates.
- Using AI-powered platforms can accelerate creative testing by generating numerous UGC-style videos from product images within minutes.
- Designate a single person to own and consistently report thumbstop rate calculations to prevent metric drift and maintain reliable trend analysis.
Table of Contents
- What Is Thumbstop Rate on Facebook and How Do You Calculate It?
- How Do You Pull Thumbstop Data From Ads Manager?
- What Is a Good Thumbstop Rate on Facebook?
- Thumbstop vs. Hook Rate vs. Hold Rate: What’s the Difference?
- Does a Higher Thumbstop Rate Mean Better Ad Performance?
- What Creative Changes Actually Increase Thumbstop Rate?
- How Should You Structure a Hook-Testing Framework?
- How Fast Creative Iteration Supports Attention Testing
- Who Should Own Thumbstop Rate as a KPI?
- Scale Your Hook Testing With Instant-ugc
- Sources
- FAQ
What Is Thumbstop Rate on Facebook and How Do You Calculate It?
Thumbstop rate isn’t a metric Meta hands you in a labeled column. It’s shorthand the industry invented to describe how well a video “stops the thumb” mid-scroll, and Meta reports the raw counts you use to build it yourself: impressions, video plays at various thresholds, and ThruPlays. That distinction matters because two teams can report wildly different “thumbstop rates” while using the exact same data, simply because one measured at 2 seconds and the other at 3.
The most common formula:
Thumbstop Rate = (3-Second Video Plays ÷ Impressions) × 100
A second version swaps in 2-second continuous views instead of 3-second plays. Both are legitimate. Neither is official. What matters is that you pick one and label it clearly in every report, something as simple as “TSR (3s/impr)” in a column header saves your team from comparing numbers that were never comparable in the first place.
Here’s a worked example using round numbers:
- Impressions: 50,000
- 3-second video plays: 6,000
- Thumbstop rate: (6,000 ÷ 50,000) × 100 = 12%
A creative that can’t clear a basic attention threshold at $50 in spend won’t magically clear it at $5,000.
How Do You Pull Thumbstop Data From Ads Manager?
Meta Ads Manager doesn’t surface thumbstop rate by name, so you’re building it from exported columns. Getting this right the first time saves you from reconciling mismatched reports three weeks into a campaign.
- Open your reporting view and customize columns to include: Impressions, 3-Second Video Plays (or 2-Second Continuous Video Views), ThruPlays, Outbound Clicks, Amount Spent, and your primary conversion event.
- Export to a spreadsheet rather than reading off the dashboard. Dashboard views round numbers and hide the raw counts you need for a clean calculation.
- Add a calculated column and name it explicitly, something like “3s Thumbstop Rate (Impr),” so anyone opening the sheet six months from now knows exactly what formula produced that number.
- Cross check the same ad set across two export windows before trusting a trend. Meta’s data can shift slightly as attribution windows finalize, and a number that looks like movement might just be reporting lag.
- Standardize the template across your team, one shared spreadsheet or dashboard definition, so a media buyer and a creative strategist are never arguing about two different “thumbstop rates” that were built differently.
Watch for three common pitfalls: sampling differences between real time and finalized data, attribution window mismatches when you compare 1-day versus 7-day click windows, and dashboard tools that pull from different data timestamps than Ads Manager’s native export.
Pro Tip: Keep a “formula key” tab in every reporting spreadsheet. One line, “TSR = 3s plays / impressions,” prevents the single most common source of confused Slack threads between media buyers and creative teams.
What Is a Good Thumbstop Rate on Facebook?
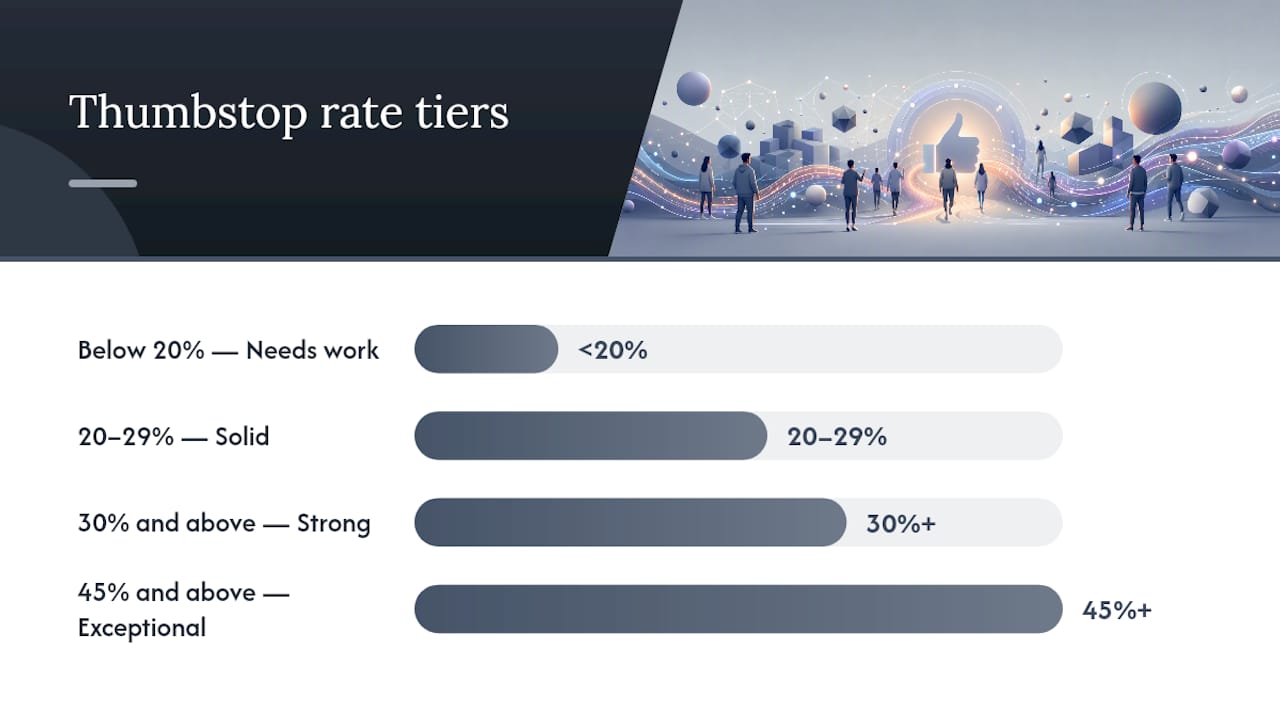
Benchmarks give you a starting point, not a scoreboard. Practitioner data points to a few practical tiers worth knowing before you judge your own numbers against them.
- Below 20%: Needs work. The opening isn’t earning enough attention relative to how many people saw it.
- 20% to 29%: Solid. This is a workable range for most feed placements and mid-funnel objectives.
- 30% and above: Strong performance, according to benchmark data from TigerTracks, and usually a sign the hook is doing real work.
- 45% and above: Exceptional, often seen in short, high-motion, or highly native-feeling creative that blends into organic content.
A thumbstop rate above 30% is treated by many performance marketers as a leading signal that a creative is worth scaling before conversion data even fully matures.
These ranges shift with context. A 15-second Stories ad and a 60-second feed video aren’t playing the same game, Stories placements tend to reward faster hooks because the swipe-away threshold is lower. Campaign objective matters too. An Awareness campaign optimized for reach behaves differently than a Sales campaign optimized for purchase events, and Meta’s own objective structure reflects that split in how the algorithm serves and measures the ad.
Audience novelty plays a role as well. A cold audience seeing your brand for the first time often produces a different thumbstop baseline than a warm retargeting pool that already recognizes your product. The fix isn’t chasing an industry-wide number, it’s building your own account-level percentiles. Pull your last 20 to 30 video ads, calculate thumbstop rate for each, and rank them. Your own 75th percentile is a far more useful benchmark than a number from a blog post written about a different account, budget, and audience.
Thumbstop vs. Hook Rate vs. Hold Rate: What’s the Difference?
These three ratios often get used interchangeably, which causes real confusion on creative teams. They measure three different moments in the viewer’s experience, and reading them together is what makes them useful.
- Thumbstop rate = 3-second plays ÷ impressions. Diagnoses whether the opening frame stops the scroll at all.
- Hook rate = plays past a slightly longer checkpoint (often 3 to 5 seconds) ÷ impressions, sometimes used as a near-synonym for thumbstop depending on the team’s convention.
- Hold rate = ThruPlays or completions ÷ initial video plays. Diagnoses whether the middle and end of the video keep people watching once they’ve stopped scrolling.
The diagnostic value comes from combining them. High thumbstop paired with low hold rate means your opener works but the body of the video loses people, a pacing or story problem, not a hook problem. Low thumbstop paired with high hold rate is rarer but tells you the few people who do stop are engaged, meaning your creative concept is sound but your first frame isn’t advertising it well. Low on both means start over on concept. High on both is what you scale. This two-step read is faster than treating any single ratio as the whole story.
Does a Higher Thumbstop Rate Mean Better Ad Performance?
A higher thumbstop rate often correlates with lower CPMs, because Meta’s auction rewards ads it predicts people will engage with, and early video attention is one of the signals that prediction leans on. Industry commentary consistently frames attention metrics as leading indicators of auction efficiency, meaning a creative that grabs attention fast tends to get cheaper distribution before a single conversion event fires.
That said, thumbstop rate has real limits, and treating it as the finish line is a mistake advertisers make constantly. To validate that an attention lift is actually valuable, compare three things between your test and control:
- Outbound CTR: Did more of those extra 3-second viewers actually click through?
- Click-to-conversion rate: Did the people who clicked convert at a similar or better rate than your baseline?
- CPA: Did the cost per acquisition hold steady or improve, not just the cost per click?
The common failure mode looks like this: thumbstop rate climbs 8 points on a flashy new hook, but conversion rate drops because the hook attracted curiosity clicks from people who were never going to buy. That’s a targeting mismatch dressed up as a creative win. If thumbstop rises but downstream numbers stay flat or worsen, the fix usually isn’t the hook, it’s either the audience receiving it or the product story in the middle of the video failing to close what the hook opened.
Pro Tip: Never scale a creative on thumbstop rate alone. Give it 48 to 72 hours of spend to see whether the CTR and CPA lift actually shows up before you commit real budget.
What Creative Changes Actually Increase Thumbstop Rate?
The first two seconds of a Facebook video ad do more work than the rest of the 30 seconds combined. Here’s a prioritized list of levers worth testing this week, starting with the ones that cost the least to produce.
- Lead with curiosity or a value statement, not a logo. Openers like “I stopped doing this and my skin cleared up” or “This saved me $200 a month” outperform brand-first intros because they promise a payoff before asking for attention.
- Use a jump cut in the first 1 to 2 seconds. A single hard cut early in the video signals motion and change, which the eye is wired to notice mid scroll far more than a static opening shot.
- Open on a close-up, not a wide shot. Faces and hands close to the camera read as native, personal content rather than polished advertising, which lowers the viewer’s guard against skipping past it.
- Add bold, readable captions in the first frame. Most Facebook video is watched with sound off, so the first line of text on screen needs to work as hard as the spoken hook.
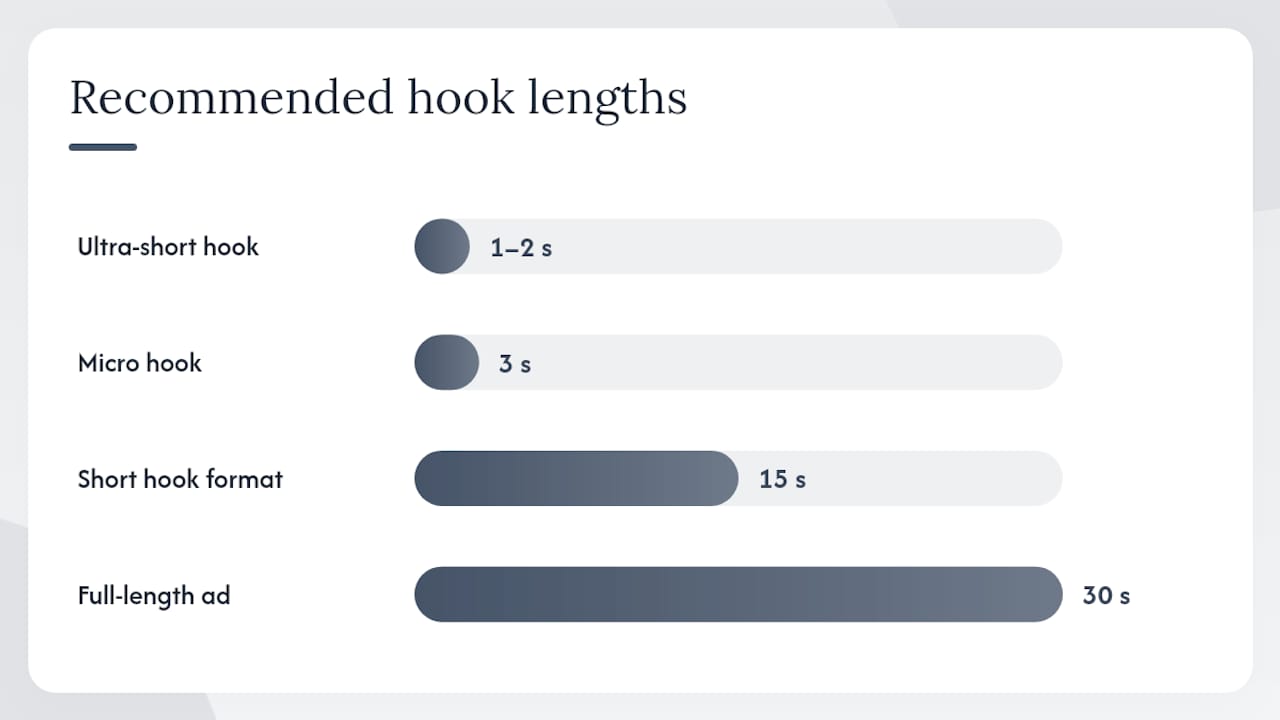
- Test ultra short 1 to 2 second variants against your standard length. Sometimes the winning creative isn’t a better story, it’s simply a faster one that respects how little time you actually have.
- Lean into native UGC visual cues, handheld framing, natural lighting, imperfect backgrounds, since these signal “this is content, not an ad” in the split second before a viewer decides to scroll past.
- Test both 9:16 and 4:5 aspect ratios rather than assuming vertical always wins; feed placements can behave differently than Stories or Reels placements.
- Batch produce multiple hook variants from the same core video. Instead of one polished ad, cut five different 3-second openers against the same body content and let the data pick the winner.
The operational insight most teams miss is volume. A single great hook is luck. A system that produces ten hook variants a week and tracks which patterns win consistently is a repeatable advantage. Native feed formatting and framing choices matter here too, an ad that looks like it belongs in the feed earns more benefit of the doubt than one that visually announces itself as promotional content. If you’re building specifically around the first-frame problem, 15-second hook-focused formats and even tighter 3-second hook structures give you a template to work from rather than starting blank.
Batch production also solves the cost problem that kills most testing programs before they start. Short-form and UGC-style creative tends to produce higher initial attention than polished studio production, and testing five cheap variants beats testing one expensive one almost every time, simply because you learn faster.
How Should You Structure a Hook-Testing Framework?
A testing framework only works if it produces a decision, not just a data point. Here’s a repeatable structure built for Facebook’s typical auction behavior and budget levels.
- Write the hypothesis before you launch. State it in one sentence: “Opening on a close-up product shot will beat our current wide-shot opener by at least 5 points of thumbstop rate.”
- Set a real control. Run your current best-performing hook alongside the new variant in the same campaign structure, same audience, same placements, same budget split.
- Give it enough spend before judging. As a practical rule, wait until each variant has accumulated at least 10,000 to 15,000 impressions before comparing thumbstop rate, fewer than that and you’re reading noise.
- Cap the time window at 3 to 5 days unless your daily spend is low enough that you need longer to hit the impression threshold above.
- Apply a scaling rule, not a gut call. Scale a variant only when it beats control on thumbstop rate AND holds or improves on CTR and CPA. Thumbstop alone is not a scaling signal.
A few operating principles keep this from turning into guesswork:
- Isolate one variable per test, hook only, or visual style only, never both at once, or you won’t know what actually moved the number.
- Run audience splits and placement controls separately from creative tests so a placement shift doesn’t get misread as a creative win.
- Pause underperforming variants within the first testing window rather than letting them bleed budget while you wait for a “maybe it’ll pick up” moment that rarely comes.
- Document every test’s hypothesis and outcome in the same sheet where you track thumbstop formulas, so six months from now your team has a real playbook instead of scattered memory.
For a deeper structural template on running these tests systematically, Vertical Brands’ creative testing framework walks through a similar staged approach worth cross-referencing against your own process.
How Fast Creative Iteration Supports Attention Testing
Testing frameworks only work when you can afford to run them repeatedly. That’s historically been the bottleneck: traditional UGC creator production can take 2 to 3 weeks and cost $500 to $2,000 per video, which makes testing ten hook variants a month financially and logistically unrealistic for most teams.
Brands using faster, lower-cost UGC-style production report ROAS moving from roughly 2.1x to 4.8x, a range that illustrates what’s possible when creative testing volume increases rather than a guaranteed outcome for every account.
Certain AI-powered platforms generate UGC-style Facebook video ads from product photos in around 90 to 120 seconds, at a lower cost per video, which changes the math on how many hooks you can realistically test in a week. These figures come from client-reported ranges and should be treated as a starting benchmark to model your own testing expectations against, not a guarantee. Document your own thumbstop and downstream results before scaling any single variant.
Who Should Own Thumbstop Rate as a KPI?
Thumbstop rate works best when one person, usually a media buyer or creative strategist, owns the weekly report and names the formula every single time it’s presented. Metric drift happens quietly: someone swaps 3-second plays for 2-second views without telling anyone, and three months later nobody trusts the trendline.
Build a short adoption checklist: label every formula in every report, review thumbstop alongside hold rate and CPA weekly, and require any new hook variant to clear your account’s own baseline before it earns real budget.
— Syno
Scale Your Hook Testing With Instant-ugc
Everything above depends on volume: the more hook variants you can afford to test, the faster you find the ones that actually move thumbstop rate and hold up downstream. Some platforms turn product photos or app screenshots into UGC-style Facebook video ads in a few minutes, at a lower cost per video, compared to the 2 to 3 weeks and higher cost per video that traditional creator production typically runs.
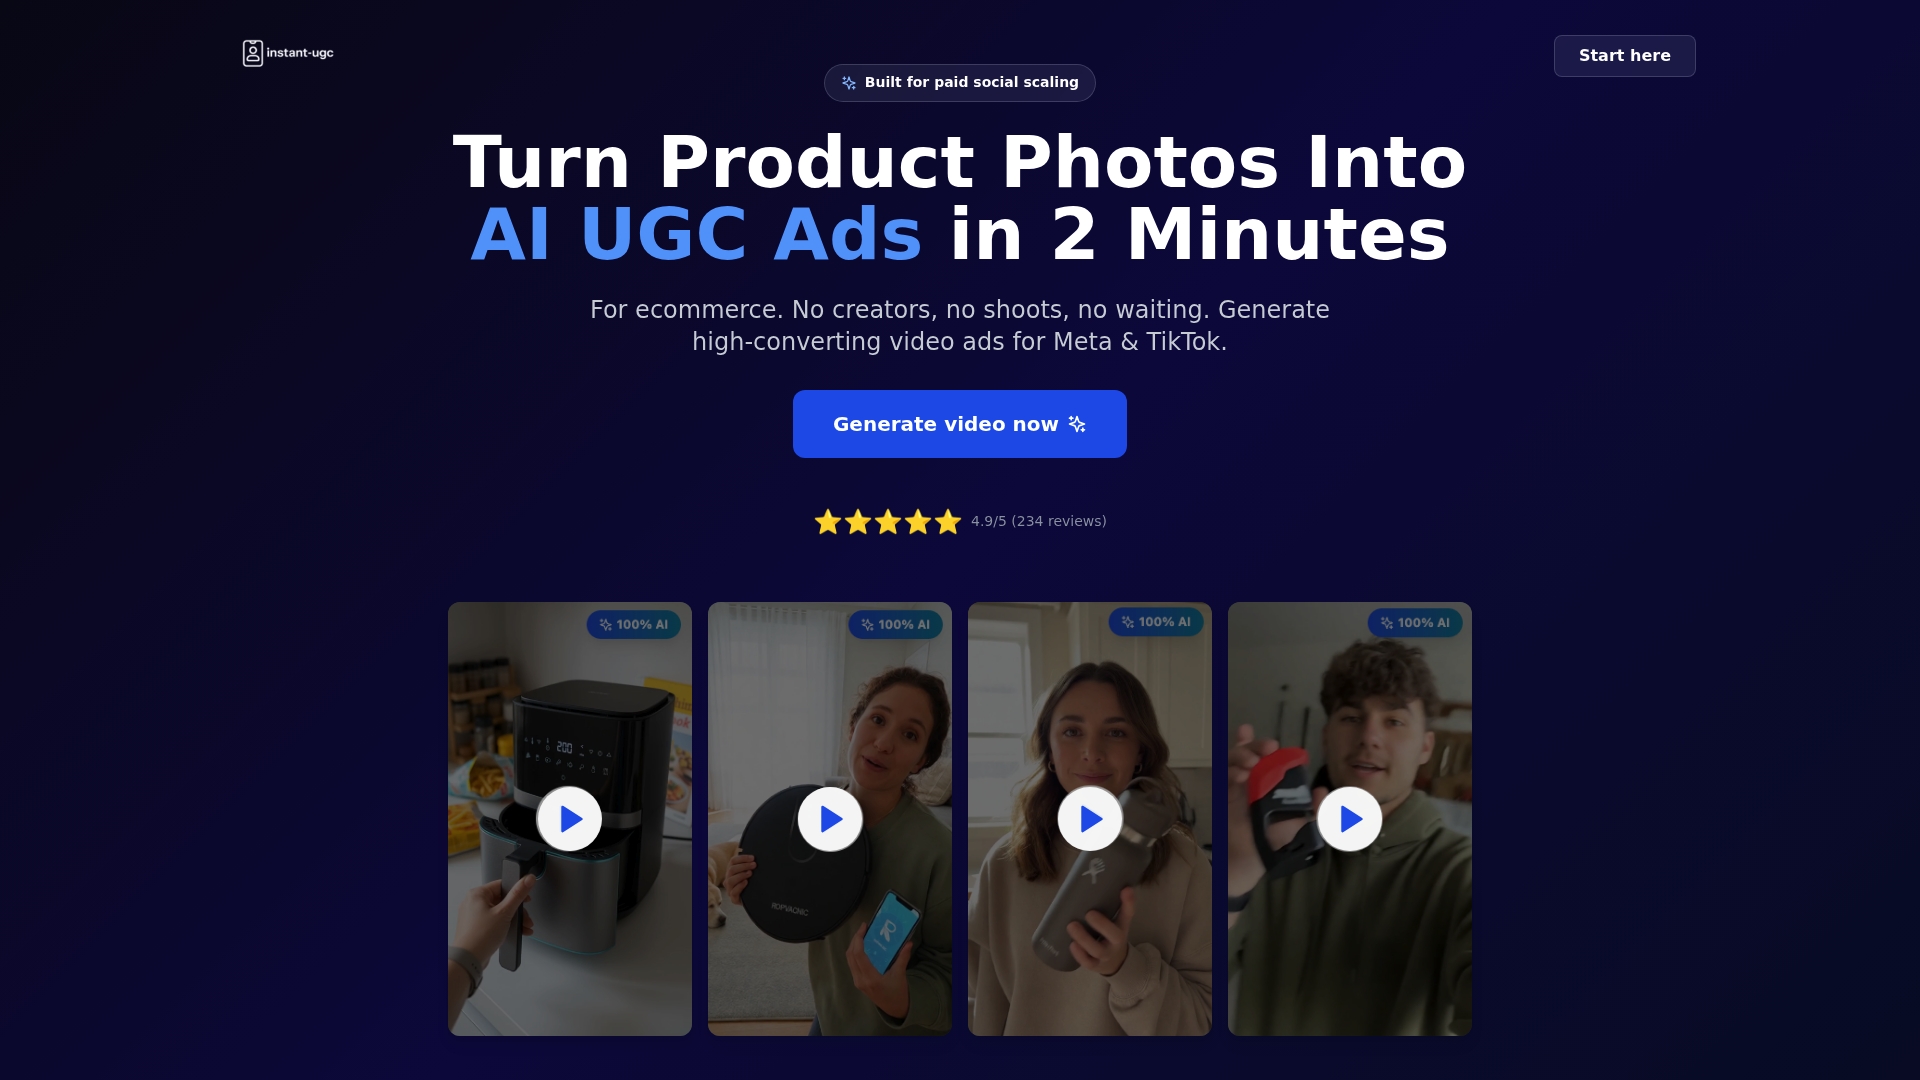
That speed and cost difference is what makes a real testing framework practical instead of theoretical. With 10+ customizable AI avatars and automatic script generation, you can batch produce five or ten distinct hook openers from the same product without waiting weeks for a creator’s schedule to clear. The platform’s Facebook-specific ad generator outputs native 9:16 formats built for feed and Stories placements, so you’re not reformatting content after the fact.
If you’re running campaigns across multiple markets, multilingual video generation in 17 languages means the same testing framework scales internationally without rebuilding creative from scratch. Start with a small batch, measure thumbstop rate against your account baseline, and let the data tell you which hooks earn a bigger budget.
Sources
For deeper reading, the Adrio breakdown of thumbstop, hook, and hold rate covers formula variations in detail, while TigerTracks’ benchmark analysis offers the fullest set of tier ranges currently available. WordStream’s objective guide explains how Meta’s campaign structure shapes which metrics matter most. To see rapid UGC-style production in action, visit the Instant-ugc homepage.
- Thumbstop rate vs hook rate vs hold rate: how to read Meta video ads | Adrio Blog
- Thumb-Stop Rate Definition & Meaning | Digital Marketing Glossary
- Every Facebook Ad Objective Available in 2026 + When To Use Them | WordStream
FAQ
What Is a Good CTR for Facebook Ads?
A solid outbound CTR for Facebook ads generally falls between 1% and 2%, though this varies heavily by objective, industry, and creative format, and should be read alongside thumbstop rate rather than in isolation.
How Much Does Facebook Pay for 100,000 Views?
Facebook doesn’t pay advertisers for video views, that’s a monetization question for content creators through programs like in-stream ads, not something relevant to advertisers running paid video campaigns and tracking thumbstop rate.
How Much Do 1,000 Clicks Cost on Facebook?
Cost per click depends entirely on your industry, audience, and creative quality, so there’s no fixed universal figure. A stronger thumbstop rate typically lowers this cost by improving the ad’s auction efficiency.
How Much Money Can I Expect for 10,000 Views on Facebook?
If you’re an advertiser, views don’t generate revenue directly, they’re a signal of attention that should be paired with click and conversion data to judge whether a video ad is working. If you’re a content creator asking about monetization payouts, that’s a separate program from advertiser-side video performance.
Can Instant-ugc Help Test Thumbstop Rate Variants Faster?
Yes. Instant-ugc generates UGC-style Facebook video ads from product photos in 90 to 120 seconds, making it practical to batch produce multiple hook variants for testing instead of waiting weeks for traditional creator production.
