
Creative Velocity: A Marketer's Guide to Faster Testing
Unlock faster testing with creative velocity, generating valuable ideas quickly. Learn to optimize your marketing campaigns today!
Creative velocity is the rate at which a marketing team produces net-new, testable creative that is both novel and valuable. It is not how many ads you push out. It is how fast you generate ideas worth testing, learn from them, and turn winners into scaled campaigns.
If you manage creative production or own a testing budget, here is where to start today. Track your cycle time, the number of days from idea to live test. Launch one rapid A/B test this week using whatever backlog of concepts you already have sitting in a shared doc or Slack channel. Then build a short list of five to ten testable hypotheses, so your next test doesn’t wait on a brainstorm.
The concept breaks into four parts worth memorizing:
- Speed: how quickly an idea moves from concept to a live, measurable test
- Novelty: whether the creative introduces a genuinely new angle, format, or hook rather than a palette swap
- Value: whether the test produces a real signal, a lift, a drop, or a clear “no,” not just noise
- Scale: how fast a validated winner gets rolled out across audiences, channels, and formats
Pro Tip: Don’t confuse volume with velocity. Publishing twenty near-identical ad variants in a week feels productive, but if none of them test a genuinely different hypothesis, you’ve generated output, not velocity. Velocity requires that each new creative teaches you something you didn’t already know.
Key Takeaways
Creative velocity works when speed, novelty, and value are tracked together, and it fails whenever any one of those three gets optimized alone.
| Point | Details |
|---|---|
| Define it correctly | Track speed, novelty, and value together, not raw output count. |
| Measure cycle time weekly | Days from brief approval to live test is your single most actionable metric. |
| Protect against fatigue | Watch creative decay rate; a fresh backlog prevents CAC from climbing quarter over quarter. |
| Slow down when uncertain | Complex launches and regulated categories need approval gates, not speed. |
| Use Instant-ugc for production bottlenecks | Instant-ugc turns product photos or screenshots into testable video ads in minutes, cutting the cost and wait time of traditional UGC production. |
Table of Contents
- What Is Creative Velocity, Exactly?
- Why Does Creative Velocity Matter for Marketing?
- How Do You Measure Creative Velocity?
- What Framework Increases Creative Velocity?
- What Are the Trade-Offs Between Speed and Quality?
- How Do AI and UGC Tools Speed Up Creative Production?
- A 30/60/90 Day Plan to Build Creative Velocity
- Real Examples of Creative Velocity in Action
- What I’ve Learned Watching Teams Try to Move Faster
- How Instant-ugc Helps You Move Faster Without Losing Quality
- Sources
What Is Creative Velocity, Exactly?
Creative velocity measures three things at once, and treating them as separate rather than combined is where most teams get the metric wrong. Speed alone tells you how fast your team works. Novelty alone tells you how creative your team is. Value alone tells you how well your creative performs. Creative velocity only exists where all three intersect.
Industry practitioners often operationalize it as net-new creatives launched per unit of time, tightly linked to a create-test-iterate testing discipline rather than a one-off production sprint. That framing matters because it ties the metric to a workflow, not just a headcount or a budget line.
Here’s a definition worth pasting into your team’s internal wiki:
Creative velocity: the rate at which a team generates, tests, and validates novel creative concepts that deliver measurable business value, tracked across the full loop from idea to scaled winner, not just from brief to delivery.
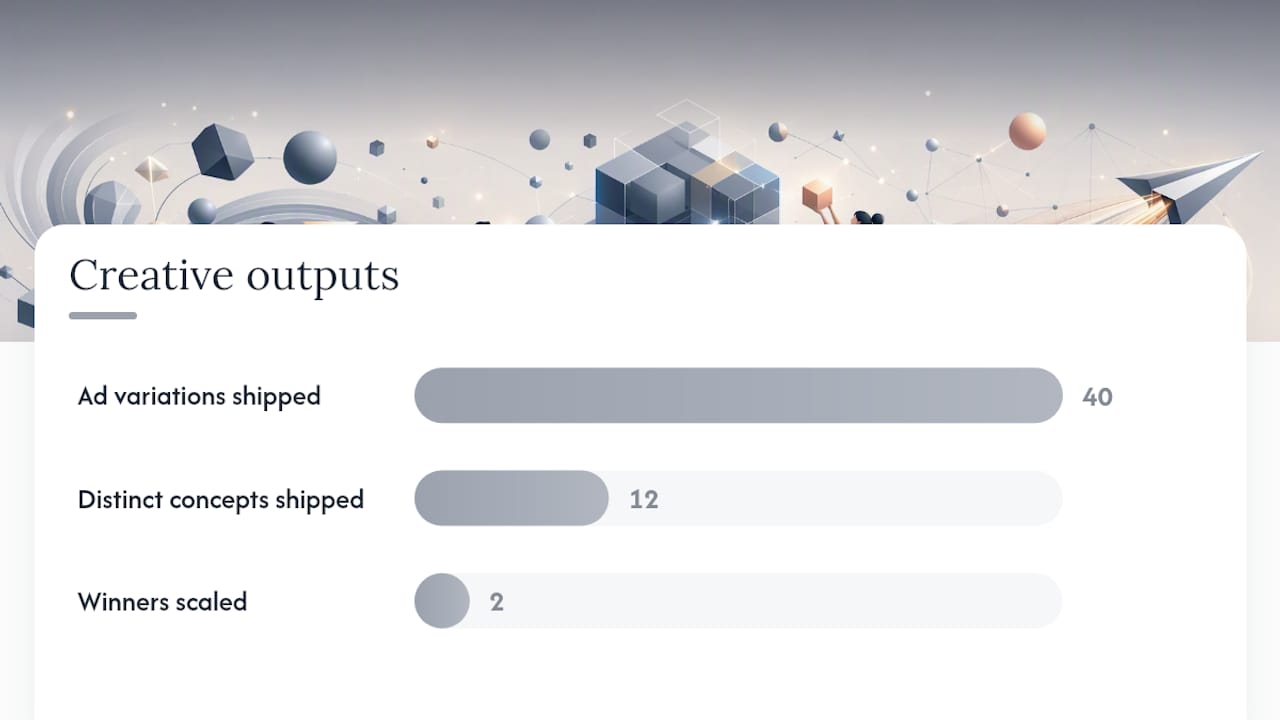
This differs sharply from simple output counts. A team that ships 40 ad variations a month but reuses the same three hooks with different color grading has high output and low velocity. A team that ships 12 genuinely distinct concepts, tests each one properly, and scales the two winners has lower output but far higher velocity, because every asset advanced actual learning.
Watch for these signals that velocity has stalled even when activity looks busy:
- Creative briefs sit in review for over a week before anyone builds against them
- The same hook or format appears in test after test with only cosmetic changes
- Winning creatives take a month or more to move from small-budget test to full campaign spend
- Nobody can say, without checking three different spreadsheets, how many genuinely new concepts launched last month
A New York Fed staff report on innovation speed and quality found that when organizations reallocate effort purely toward speed, output often rises while long-run quality declines, a pattern that shows up in creative production just as it does in R&D labs. That’s the tension creative velocity is built to manage: move fast, but measure whether what you’re moving is actually new and actually working.
Why Does Creative Velocity Matter for Marketing?
Faster creative velocity shortens the distance between a hypothesis and an answer. That compresses your entire testing calendar and, more importantly, it compresses the time your best-performing ad spends sitting in a small test budget instead of scaled spend.
Consider the mechanics. If your cycle time drops from three weeks to three days, you can run roughly seven times as many validation cycles in the same quarter. Each cycle either confirms a winner or kills a loser. Over a year, that difference compounds into a testing calendar with real statistical weight behind it, rather than four or five big swings taken on gut instinct.
Higher velocity also fights creative fatigue directly. Audiences on Meta and TikTok-style platforms tire of repeated creative within days, not months, especially in paid social where frequency climbs fast. Teams with a thin backlog of fresh concepts watch conversion rates decay as the same three ads run on repeat. Teams with a deep, fast-moving pipeline swap in new variants before fatigue sets in, protecting cost-per-acquisition instead of watching it climb quarter over quarter.
Three strategic situations reward high velocity in particular:
- Seasonal bursts, where a narrow window (holiday, back-to-school, a flash sale) demands rapid iteration against a hard deadline
- Rapid product launches, where you need dozens of testable angles before you know which audience segment responds
- Continuous always-on testing, where a steady cadence of new creative keeps CAC from drifting upward over months
Empirical research on innovation speed backs a more nuanced view than “faster is always better.” One study found that speed correlates with success mainly when the path forward is predictable, meaning velocity is most valuable as an acceleration tool for validating concepts you already have some confidence in, not a blunt instrument for every creative decision. Use it to move known-good ideas to scale faster. Don’t use it as a substitute for strategic thinking on genuinely novel bets.
How Do You Measure Creative Velocity?
You need a small set of KPIs that your creative team, your media buyers, and your CMO can all look at without translation. Here’s the core set, along with how to calculate each one.
| Metric | Formula / Calculation | Reporting Cadence |
|---|---|---|
| Net-new creatives per week | Count of distinct new concepts launched to test (not resized duplicates) | Weekly |
| Cycle time | Days from brief approval to first live impression | Weekly |
| Test velocity | Number of statistically valid tests completed per month | Monthly |
| Conversion per creative | Conversions divided by unique creative impressions, per asset | Weekly |
| Reach-to-scale | Days from test launch to reaching your minimum sample size for a decision | Per test |
| Creative decay rate | Percentage drop in CTR or CVR from week one to week three of a live asset | Weekly |
Net-new creative counts and cycle time belong on the creative team’s own dashboard, checked weekly, because they’re operational and actionable day to day. Conversion per creative and creative decay rate belong in the reporting you send executives, because those two numbers answer the question every CMO actually cares about: is faster production translating into better performance, or just more activity?
Pro Tip: Never report a single blended average across all campaign types. A branding campaign and a direct-response retargeting campaign have wildly different natural decay rates and cycle times, and averaging them together hides the exact signal you’re trying to catch. Segment every metric by campaign type before you trust the number, and read more on structuring these reports in a UGC CRO tool guide.
What Framework Increases Creative Velocity?
The operating loop that works across most performance marketing teams has four stages: create, test, iterate, scale. The failure point is almost never the creation stage. It’s the handoff between stages, where nobody owns the decision to move forward or kill an idea.
Assign these roles explicitly, even on a small team:
- Creative lead owns the concept backlog and decides what gets built next
- Experiment owner sets the test parameters (budget, duration, sample size) and calls the result
- Data analyst validates that a “win” is statistically real, not noise from a small sample
- Production coordinator manages the queue so creative doesn’t bottleneck behind a single designer or editor
Workflows should run on a visible backlog (a Trello board, an Airtable, or a dedicated experiment tracker), paired with production tooling that removes manual bottlenecks and an automated system for tagging and archiving test results so nobody re-tests a concept that already failed six months ago. Workflow automation platforms like Streamline AI or asset pipeline tools like Valiz are worth evaluating if your team still routes creative approvals through email threads.
A simple operational checklist to run every sprint:
- Backlog has at least five untested hypotheses queued at all times
- Every live test has a named experiment owner and a defined kill date
- Winning creatives move to scale within 72 hours of a validated result
- Losing creatives get archived with a one-line note on why they failed
Some finance and lending platforms describe their own operational advantage as matching supply and demand quickly, a useful analogy for creative teams: your backlog is supply, your test slots are demand, and velocity is what happens when neither one sits idle waiting on the other.
What Are the Trade-Offs Between Speed and Quality?
Speed is not free. The same New York Fed research on inventor allocation and innovation quality found that pushing teams toward faster output can measurably reduce the quality of what gets produced, and that effect scales up when speed becomes the only thing being measured and rewarded. Apply that lesson to creative production: a team incentivized purely on output count will hit the number and produce shallow variations that don’t teach you anything new.
Guardrails worth putting in place before you accelerate:
- A brand safety checklist that every AI-generated or rapidly produced asset passes before it goes live
- A minimum quality threshold, even a simple one, like requiring two human eyes on script and visuals before launch
- Fixed sample-size rules for every test, so nobody calls a winner off 40 clicks
- An approval gate specifically for moving a test from small budget to scaled spend, distinct from the approval gate for launching the test itself
Watch for these common failure modes when velocity programs go wrong: poor attribution (crediting a lift to the wrong creative because two tests overlapped), mis-specified tests (changing three variables at once and learning nothing specific), and creative fatigue mistaken for audience saturation when it’s really just stale assets.
Speed helps most when the path forward is already reasonably predictable. It helps least, and can actively mislead you, when you’re exploring genuinely uncertain territory where a fast wrong answer is worse than a slow right one.
Market conditions change this calculus too. Research on innovation speed under uncertainty and competition found that high market uncertainty tends to favor faster, incremental moves, while intense competition can push companies toward slower, more radical innovation instead of speed for its own sake. Deliberately slow down for complex launches, regulated categories, or anything where a mistake carries real brand or legal risk.
How Do AI and UGC Tools Speed Up Creative Production?
AI-driven production tools compress the parts of the pipeline that used to eat the most calendar time: script ideation, rendering across multiple aspect ratios, and localizing a single concept into a dozen languages. What once required a production team, a shoot schedule, and a multi-week turnaround can now happen inside a single afternoon for testable variants.

Traditional UGC production has typically taken two to three weeks per video, with costs ranging from $500 to $2,000 per asset, numbers that make rapid, high-volume testing financially impractical for most mid-sized teams. AI-driven platforms that turn product photos or app screenshots into finished video ads in minutes change that math entirely, and that shift is exactly what makes rapid, multi-variant testing viable on a normal marketing budget rather than a luxury reserved for enterprise budgets.
Capabilities worth screening for when you evaluate tooling:
- Photo-to-video or screenshot-to-video generation that produces a finished asset in minutes, not weeks
- Multiple aspect ratios and formats generated from one source concept (feed, Stories, Reels)
- Built-in localization across a meaningful number of languages, not just subtitle overlays
- Automated script generation tied to product data, so ideation doesn’t bottleneck on a copywriter
- Batch variant generation, so you can produce five hooks against one product in a single session
Pro Tip: Run a side-by-side test between your AI-generated variant and your best human-made creative before scaling either one. Authenticity risk is real: audiences increasingly recognize templated AI patterns, so quality drift during scale is the failure mode to watch, not the initial production speed.
The most competitive teams are shifting from speed-to-market thinking to speed-to-relevance, focusing on the fewest experiments that actually move a metric rather than maximum output for its own sake.
That shift toward speed-to-relevance matters because AI shortens replication cycles for competitors too. Anyone can copy a fast-produced ad format within days. The durable advantage sits in your measurement discipline and your backlog of validated hypotheses, not in raw production speed alone. For a deeper look at applying this to short-form formats, the UGC video marketing guide walks through practical setups.
A 30/60/90 Day Plan to Build Creative Velocity
Here’s a phased plan that assumes you’re starting close to zero, no formal metrics, no dedicated backlog, and no clear testing cadence.
- Days 1-30: Establish baseline cycle time and current net-new creative count. Build an experiment backlog of at least 15 hypotheses. Pilot one production tool on a low-stakes campaign to see actual time savings firsthand.
- Days 31-60: Ramp production cadence to a fixed weekly output target. Run controlled A/B tests with fixed sample sizes rather than eyeballing results. Automate the most repetitive task in your pipeline, usually resizing or script drafting. Tighten your approval gates based on what broke in month one.
- Days 61-90: Scale every validated winner into full campaign budget within your 72-hour rule. Reallocate budget from underperforming evergreen creative into the tested pipeline. Build velocity metrics directly into your quarterly planning deck so leadership sees them alongside CAC and ROAS.
A short checklist to keep the plan honest:
- Baseline metrics documented before day 10
- At least one tooling pilot completed by day 30
- Weekly test cadence hit in at least 80% of weeks by day 60
- Velocity metrics appearing in the standard executive report by day 90
Pro Tip: Isolate the lift attributable to velocity itself by holding your media budget flat while you accelerate creative cadence. If conversion rates rise without a budget increase, that’s a clean signal the creative pipeline, not spend, drove the change.
For teams specifically piloting rapid video production against a testing calendar, a use-case walkthrough like scale video ads fast maps closely to the 60 to 90 day ramp phase.
Real Examples of Creative Velocity in Action
Challenge: A direct-to-consumer skincare brand ran the same five hero ads for four months and watched CAC climb steadily as frequency saturated its core audience. Action: The team built a 20-concept backlog, cut cycle time from 18 days to 4, and ran controlled tests in batches of five variants per week. Result: Within six weeks, three new hooks outperformed the legacy set, and CAC dropped back toward its earlier baseline as fresh creative replaced fatigued assets.
Challenge: A mobile app developer needed App Store creative for a launch window with only three weeks of lead time. Action: Instead of one polished trailer, the team generated a dozen short testimonial-style variants and ran them simultaneously across a small ad budget. Result: Two variants reached statistical significance within the first ten days, and the team scaled spend on those before the launch window closed, rather than waiting for a single “hero” asset to be perfect.
Challenge: A seasonal retailer needed dozens of ad variants for a two-week holiday push without a proportional increase in production headcount. Action: The team standardized a rapid-production workflow and focused human review only on final approval, not first drafts. Result: Output tripled without adding staff, and the retailer reported catching two underperforming concepts early enough to reallocate budget mid-campaign instead of after the window closed.
| Case | Cycle Time Before | Cycle Time After | Key Outcome |
|---|---|---|---|
| Skincare brand | 18 days | 4 days | CAC returned to baseline after fatigue reversal |
| App launch team | Single asset, 3 weeks | Batch of 12, same window | Two variants validated within 10 days |
| Seasonal retailer | Manual, capacity-limited | Standardized rapid workflow | Output tripled, no added headcount |
The pattern across every one of these examples is the same: velocity didn’t help because it produced more ads. It helped because it produced more chances to learn something true about what the audience actually wanted, and it did so before the campaign window closed.
Learnings from one platform rarely transfer cleanly to another; a hook that works on a TikTok-style feed often underperforms on Meta and vice versa. Treat cross-platform scaling as its own testing step, not an assumption.
What I’ve Learned Watching Teams Try to Move Faster
Most creative velocity programs don’t fail because the ideas are bad. They fail because of three unglamorous problems: culture, tooling, and measurement, usually in that order.
Culture fails first. A creative team that has spent years being rewarded for polish resists a workflow that asks them to ship rough, testable concepts fast and be comfortable when most of them lose. That discomfort is normal, and leaders who don’t name it directly end up with a team that quietly slow-walks the new process back to the old one within a quarter.
Tooling fails second, usually in the opposite direction people expect. Teams don’t fail because they lack sophisticated software. They fail because they adopt three overlapping tools that all claim to solve production speed, and nobody owns which one is the system of record. One rapid-production tool, cleanly integrated into one experiment tracker, beats five disconnected point solutions every time.
Measurement fails last but does the most long-term damage, because a team that can’t prove velocity worked will lose budget to the next reorg regardless of how the campaigns actually performed. Two rules I’d enforce without exception on any team I ran: never let a test go live without a named owner and a kill date, and never report a velocity metric to leadership without also reporting the decay rate on the assets you already scaled. Speed without that second number is just a highlight reel.
How Instant-ugc Helps You Move Faster Without Losing Quality
If your creative bottleneck sits at production, not ideation, that’s the exact gap Instant-ugc closes. Instead of waiting several weeks and paying a substantial amount per traditional UGC video, you turn a product photo or app screenshot into a finished, testable video ad in minutes, for a fraction of the typical cost per asset.
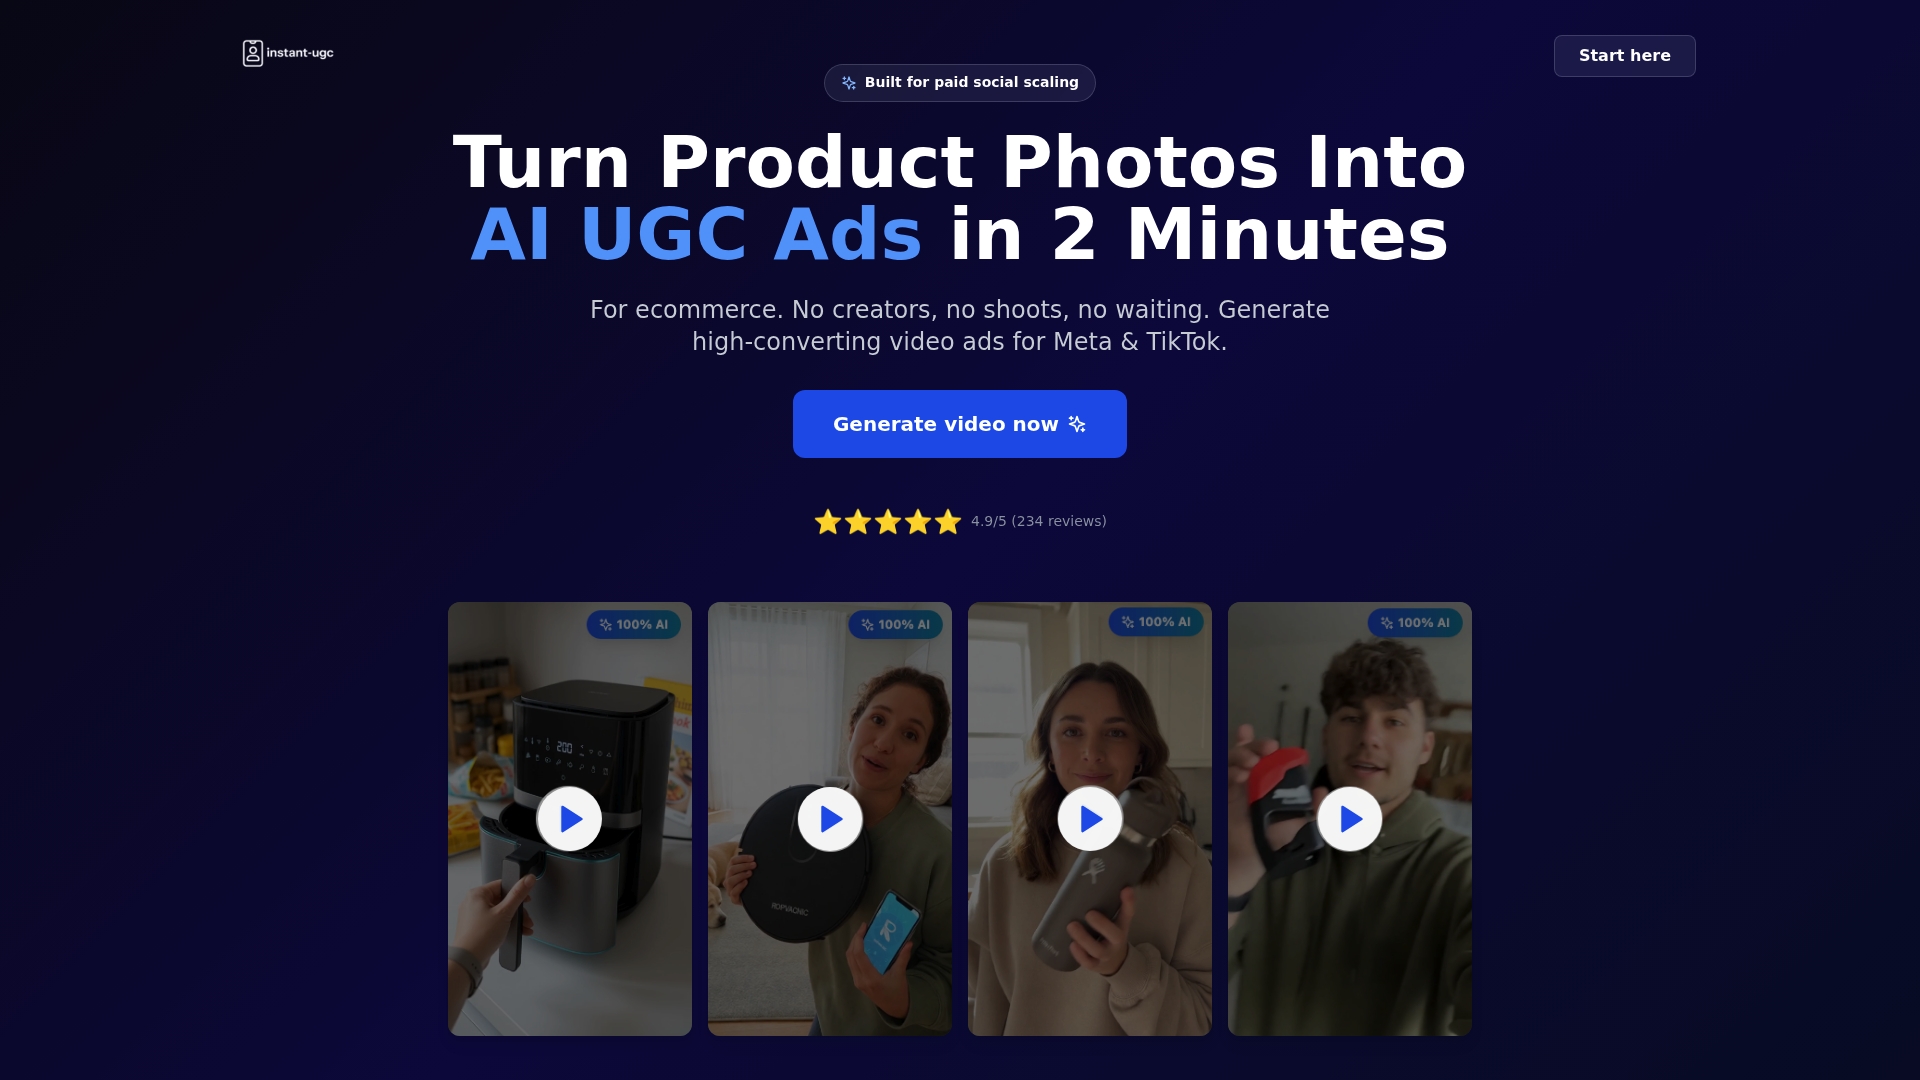
That kind of turnaround directly serves the metrics covered above: net-new creatives per week goes up because production stops being the bottleneck, and cycle time drops because there’s no shoot to schedule and no editor queue to wait on. The platform generates 9:16 video in under two minutes, supports 17 languages for fast localization, and offers over 10 customizable AI avatars, so batch variant testing across audiences and markets doesn’t require a proportional increase in headcount. Brands using the platform have reported ROAS climbing from 2.1x to 4.8x once testing cadence picked up.
Look specifically for capabilities that map to velocity, not just video output: script automation so ideation doesn’t bottleneck on a copywriter, multi-format rendering for feed and Stories in one pass, and authentic-feeling avatar delivery that avoids the templated look that erodes trust over time. If you sell a physical product, the AI product video generator workflow is built for that. If you’re testing on TikTok specifically, the AI TikTok ads generator is the more direct starting point.
A practical pilot to run in your next 30 days: generate 100 test creatives across five hooks and three markets, and measure your resulting cycle time and conversion-per-creative against your current baseline. Start that pilot on the Facebook AI ads generator page and compare the numbers yourself.
Sources
- Need for Speed: Quality of Innovations and the Allocation of Inventors
- Is faster really better? An empirical test of the implications of innovation speed
